Data Management Quiz: Monday, December 13
Students, this is a reminder that you will have a Graphing Quiz on Monday, December 13. Here's what you'll need to know how to do for the quiz:
Grade 4's
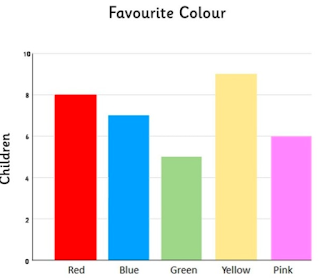
- Read and interpret a single bar graph with a many-to-one scale (ex: where the scale on the y axis goes up by 2's or 5's or another number)
- Read and interpret a pictograph with a many-to-one key (ex: where one picture of a can = 10 cans in real life)
- Explain why a many-to-one scale may be used, instead of one-to-one
- Create and label a single bar graph with a many-to-one scale, using the criteria practiced in class (see below)
- Create and label a pictograph
Grade 5's
- Read and interpret a double bar graph
- Explain the difference between first and second-hand data and when we would use each
- Create and label a double bar graph, following the criteria we used in class (see below)

If you're looking for some extra practice on these topics, I suggest playing on Mathletics.